The Samsung 860 QVO (1TB, 4TB) SSD Review: First Consumer SATA QLC
by Billy Tallis on November 27, 2018 11:20 AM ESTWhole-Drive Fill: Testing SLC Cache Size
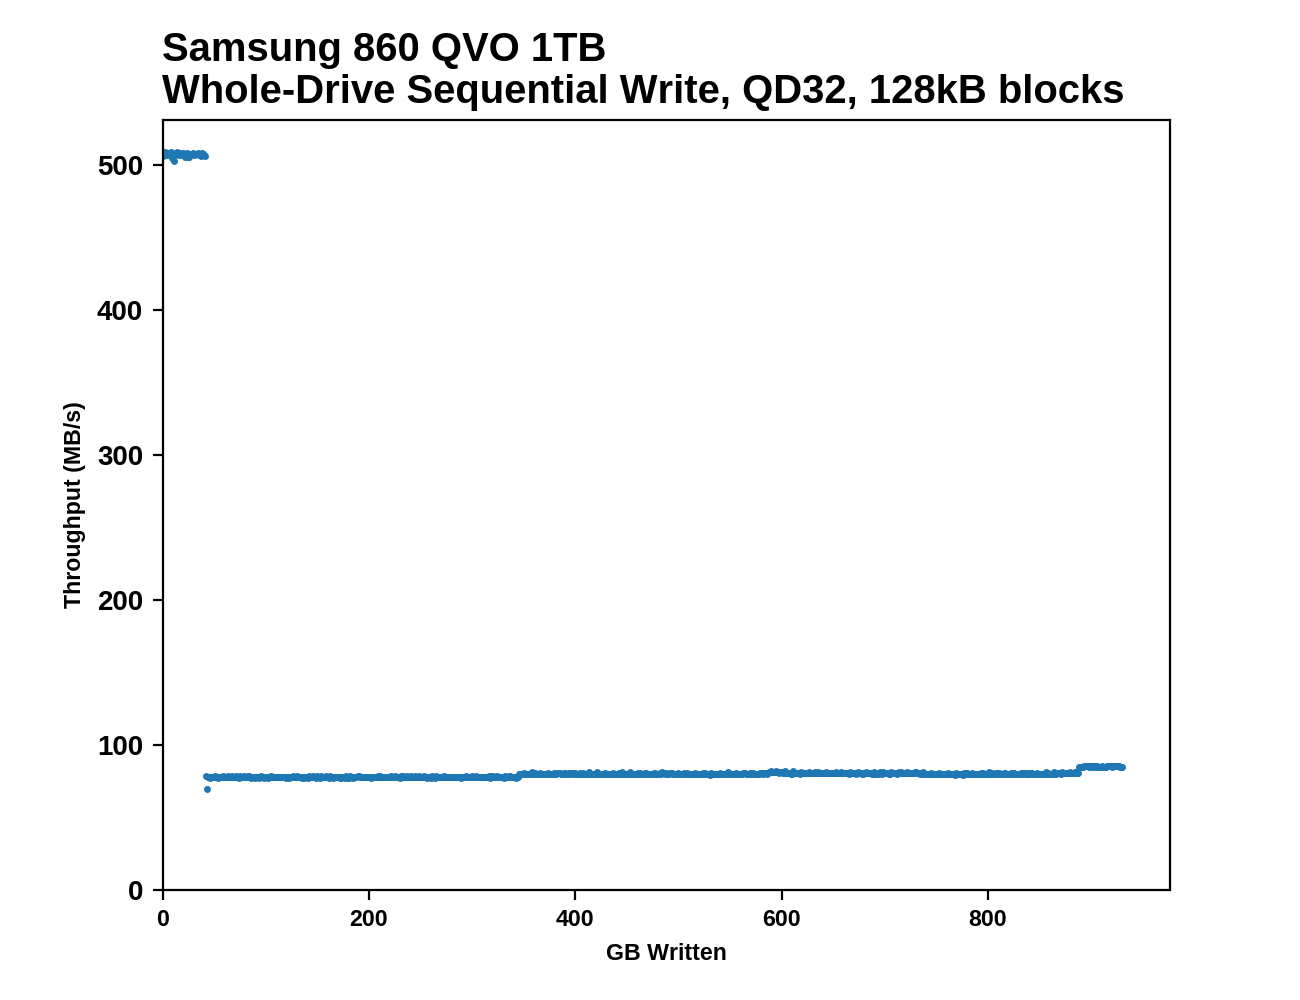
This test starts with a freshly-erased drive and fills it with 128kB sequential writes at queue depth 32, recording the write speed for each 1GB segment. This test is not representative of any ordinary client/consumer usage pattern, but it does allow us to observe transitions in the drive's behavior as it fills up. This can allow us to estimate the size of any SLC write cache, and get a sense for how much performance remains on the rare occasions where real-world usage keeps writing data after filling the cache. Samsung's official specifications are:
| Samsung 860 QVO Secondary Specifications | |||||
| Capacity | 1 TB | 2 TB | 4 TB | ||
| SLC Cache Size |
Min | 6 GB | 6 GB | 6 GB | |
| Max | 42 GB | 78 GB | 78 GB | ||
| Sequential Write |
SLC Cache | 520 MB/s | |||
| QLC | 80 MB/s | 160 MB/s | 160 MB/s | ||
Our results show the following:
 |
|||||||||
The Samsung 860 QVOs run out of SLC cache right on schedule, at 42 GB for the 1TB model and 78 GB for the 4TB. After that, they are both slow and very steady for the rest of the test.
 |
|||||||||
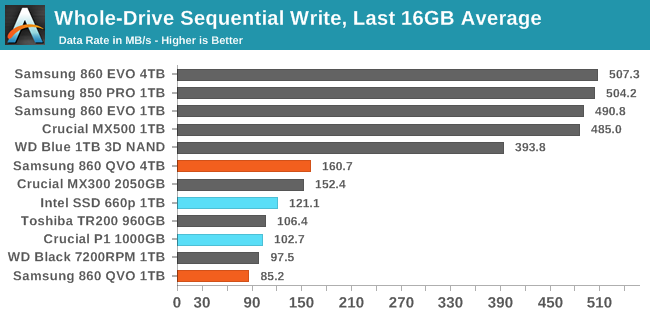
| Average Throughput for last 16 GB | Overall Average Throughput | ||||||||
The 1TB 860 QVO falls below the sequential write speed of a 1TB hard drive once the SLC cache runs out, but the 4TB model is able to sustain twice the write speed and remains ahead of not just the hard drive's speed, but also some of the slower TLC drives.
BAPCo SYSmark 2018
BAPCo's SYSmark 2018 is an application-based benchmark that uses real-world applications to replay usage patterns of business users, with subscores for productivity, creativity and responsiveness. Scores represnt overall system performance and are calibrated against a reference system that is defined to score 1000 in each of the scenarios. A score of, say, 2000, would imply that the system under test is twice as fast as the reference system.
SYSmark scores are based on total application response time as seen by the user, including not only storage latency but time spent by the processor. This means there's a limit to how much a storage improvement could possibly increase scores, because the SSD is only in use for a small fraction of the total test duration. This is a significant difference from our ATSB tests where only the storage portion of the workload is replicated and disk idle times are cut short to a maximum of 25ms.
| AnandTech SYSmark SSD Testbed | |
| CPU | Intel Core i5-7400 |
| Motherboard | ASUS PRIME Z270-A |
| Chipset | Intel Z270 |
| Memory | 2x 8GB Corsair Vengeance DDR4-2400 CL17 |
| Case | In Win C583 |
| Power Supply | Cooler Master G550M |
| OS | Windows 10 64-bit, version 1803 |
Our SSD testing with SYSmark uses a different test system than the rest of our SSD tests. This machine is set up to measure total system power consumption rather than just the drive's power.
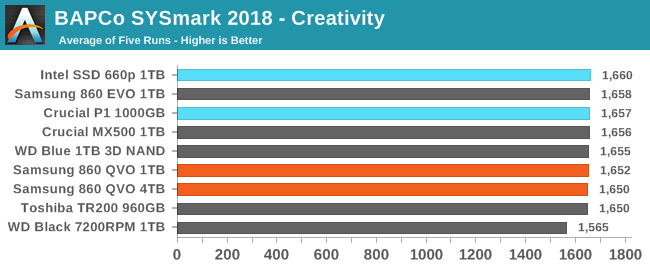
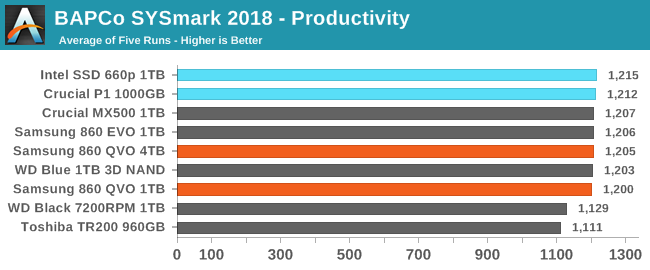
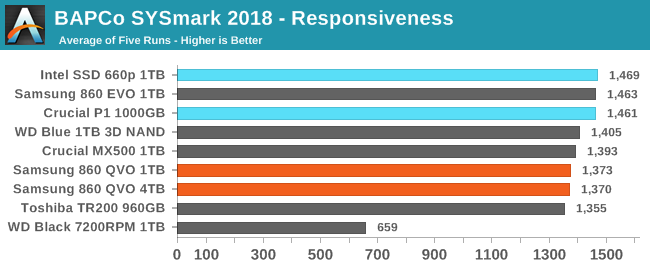
The 860 QVO isn't any slower for compute-heavy interactive tasks than the mainstream SATA SSDs, and even on the more I/O-bound Responsiveness test the 860 QVO is ahead of the DRAMless TLC drive and not far behind the Crucial MX500.
Energy Use
The SYSmark energy usage scores measure total system power consumption, excluding the display. Our SYSmark test system idles at around 26 W and peaks at over 60 W measured at the wall during the benchmark run. SATA SSDs seldom exceed 5 W and idle at a fraction of a watt, and the SSDs spend most of the test idle. This means the energy usage scores will inevitably be very close. A typical notebook system will tend to be better optimized for power efficiency than this desktop system, so the SSD would account for a much larger portion of the total and the score difference between SSDs would be more noticeable.
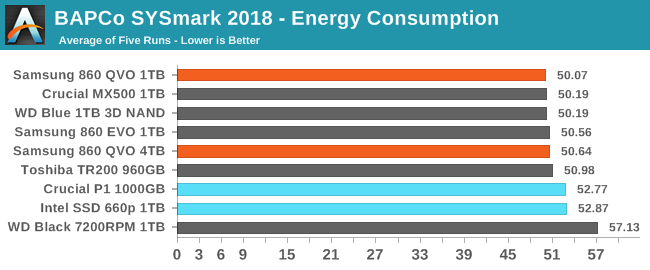
The Samsung 860 QVO's energy usage during SYSmark is not a problem at all, with it using slightly less energy than the mainstream SATA TLC drives.


109 Comments
View All Comments
Impulses - Thursday, November 29, 2018 - link
Bleh, googling revealed that WAS on Amazon... It never triggered my price alerts, hrm, even tho it's definitely showing on Camelcamel's price history now, weird. Maybe I glossed over it entirely, oh well.The_Assimilator - Thursday, November 29, 2018 - link
https://www.pcgamer.com/crucials-2tb-mx500-ssd-is-...hojnikb - Tuesday, November 27, 2018 - link
@BillyCan you do a data retention test ? Like writing the drive with data (H2testw seems to be the pick of the bunch) and disconnecting it. I'm interested how data retention holds up over time.
JoeyJoJo123 - Tuesday, November 27, 2018 - link
Don't use SSDs for cold storage. Testing this is absurdly stupid and a waste of a reviewers time.Disconnect drive for 10 days: Replug it in and verify data's still all there. Yep.
Disconnect drive for 15 days: Replug it in and verify data's still all there. Yep.
Disconnect drive for 20 days: Replug it in and verify data's still all there. Yep.
(We're already at 45 days, or 1.5 months, and chances are the data's still all there, are you getting how and why this kind of testing is stupid?)
By the time you get to sufficiently long enough time periods to see some change in data you'd have wasted over a year trying to find a time period (within 5 days) where you know the drive will start losing data. This is just as absurd as asking reviewers to test NAND flash endurance by hammering the drive 24/7 for years until it dies. By the time it DOES die something better will have already arrived on the market. And disregarding all that, testing with a sample size of ONE is not indicative of any relevant performance characteristics for your ONE drive.
If you want to use cold storage backups, either use a mechanical hard drive, a tape drive, or invest in cloud storage and encrypt your data before uploading it.
Testing the cold storage capabilities of a sample size of ONE QLC SSD does nothing but prove that it's a less satisfactory use case for the technology than using a mechanical hard drive.
HollyDOL - Tuesday, November 27, 2018 - link
I _think_ you can find Google or Facebook statistics on their SSDs, error rate etc. in representative volumes. But ofc it is enterprise grade hardware.hojnikb - Wednesday, November 28, 2018 - link
Not for QLC.hojnikb - Wednesday, November 28, 2018 - link
You're not thinking very far. As QLC is very cheap, it will be used in likes of flash drives, SD cards and portable SSDs. With these, it's not expected for them to be powerred at all time and in the case of sd cards and flash drives, it's not likely controller would do any kind of data rewritting.So this is very much a relavant test, that might give us ideas on how it performs. And no, you don't have to wait a year to see something; data curruption can be presented a lot sooner if from of read error and slower read speed in general. A more extreme approach is to heat the drive, which accelarates the process.
eddieobscurant - Tuesday, November 27, 2018 - link
Horrible performance by samsung 64 layer qlc nand. Way slower than intel's/micron's . Especially the 4k random reads are slower than my first ssd 10 years ago, the intel x-25m.In order for samsung 860 qvo to make sense, it should be priced below 0.10$/gb
stargazera5 - Tuesday, November 27, 2018 - link
Great, now that we have QLC down, we can move on to PLC (5 bits per cell) and 1 drive write per week.CheapSushi - Wednesday, November 28, 2018 - link
And from the current trend, it still won't be much cheaper. =P